Skip to content

Data studies

Original studies built from primary data: government surveys and published provider research, transcribed into pinned, tested datasets and explained without hype. Every figure carries its source, lens, and data year, every table downloads as CSV under CC BY 4.0, and the lead chart and main table of each study can be embedded with attribution built in.

All 11 studies

Data study Retirement & FIRE

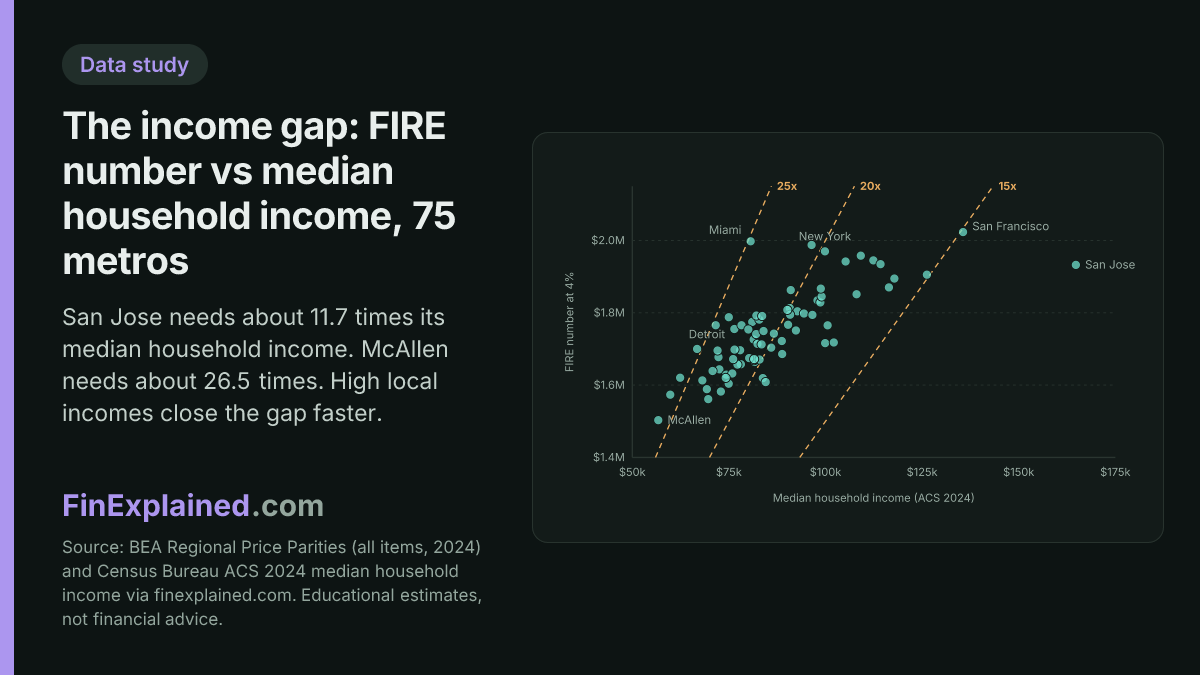
How Much Money You Need to Reach FIRE in America's Largest Metro Areas (2026)

What early retirement costs in the 75 largest US metros in 2026: estimated FIRE numbers from $1.5 million to $2 million, built from BEA and Census data.

FinExplained data study. Sources: BEA Regional Price Parities (all items, 2024) and Census Bureau ACS 2024 median household income. Educational estimates, not financial advice. Data year 2024.

13 min read Updated

Read the study Download the CSV Embeddable chart Embeddable table

Data study Net Worth & Benchmarks

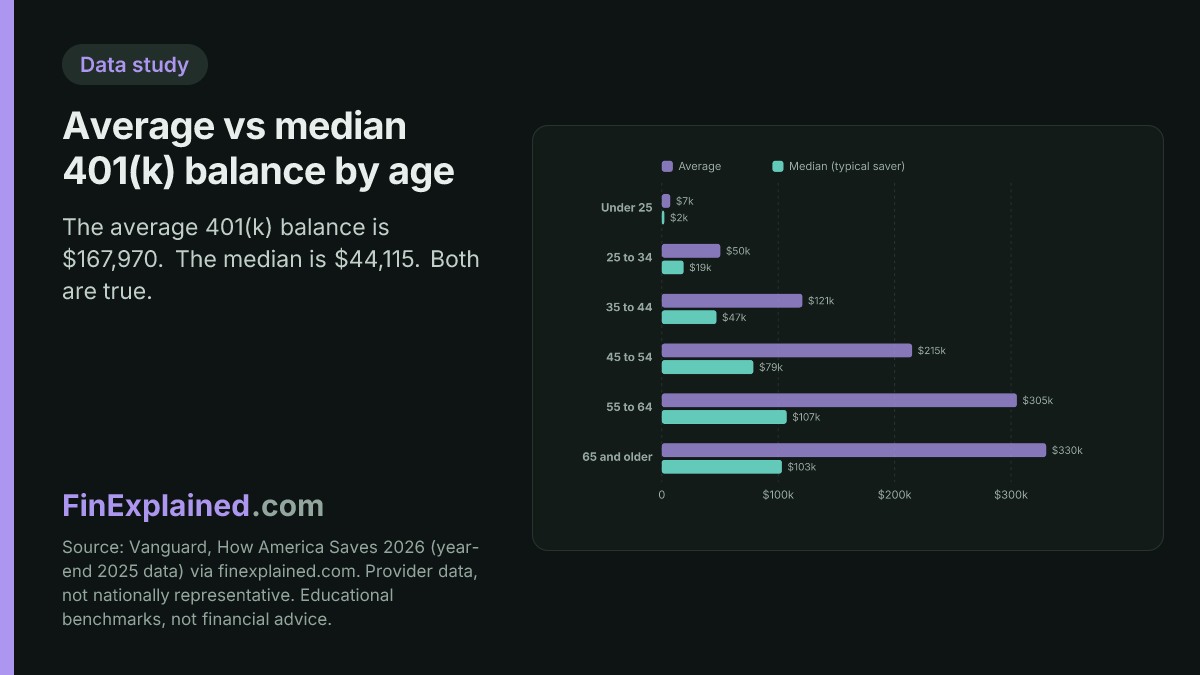
Average and Median 401(k) Balance by Age: How Do You Compare? (2026 Data)

Vanguard's year-end 2025 data puts the average 401(k) balance at $167,970 and the median at $44,115. See both by age and what the gap means for you.

Source: Vanguard, How America Saves 2026 (year-end 2025 data). Provider data, not nationally representative. Educational benchmarks, not financial advice. Data year 2025.

19 min read Updated

Read the study Download the CSV Embeddable chart Embeddable table

Data study Net Worth & Benchmarks

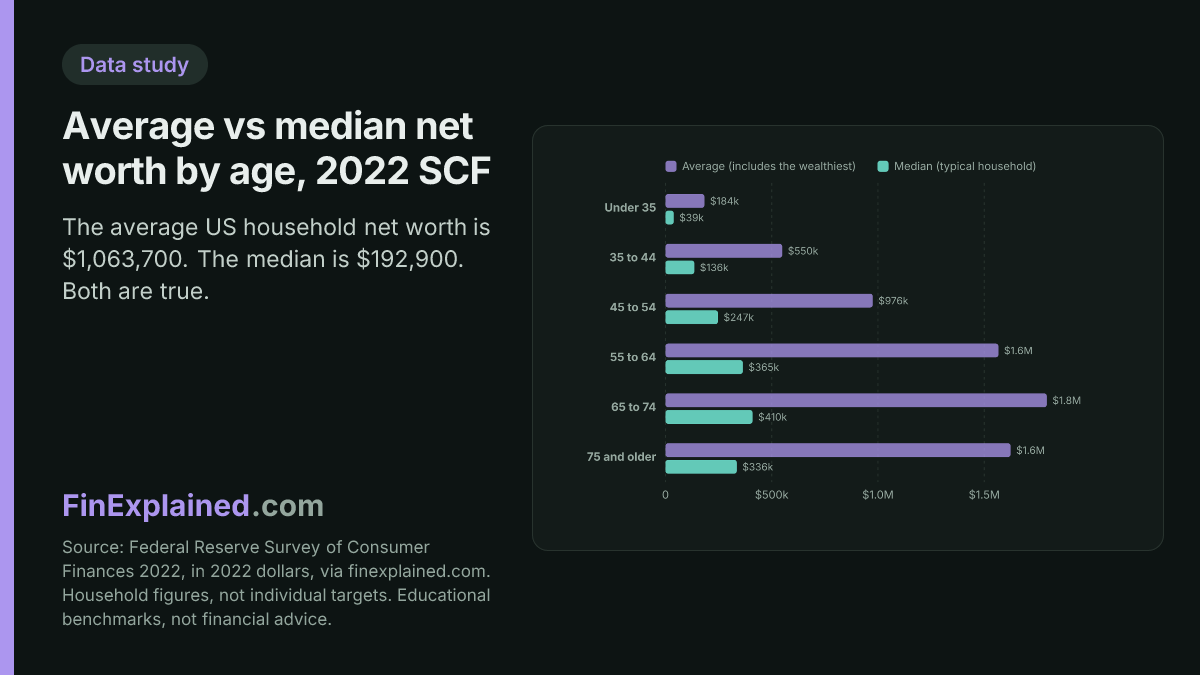
Average and Median Net Worth by Age: How Do You Compare?

The median US household net worth was $192,900 in the Fed's 2022 survey, while the average was $1,063,700. See both by age and what the gap means for you.

Source: Federal Reserve Survey of Consumer Finances 2022, in 2022 dollars. Household figures, not individual targets. Educational benchmarks, not financial advice. Data year 2022.

18 min read Updated

Read the study Download the CSV Embeddable chart Embeddable table

Data study Net Worth & Benchmarks

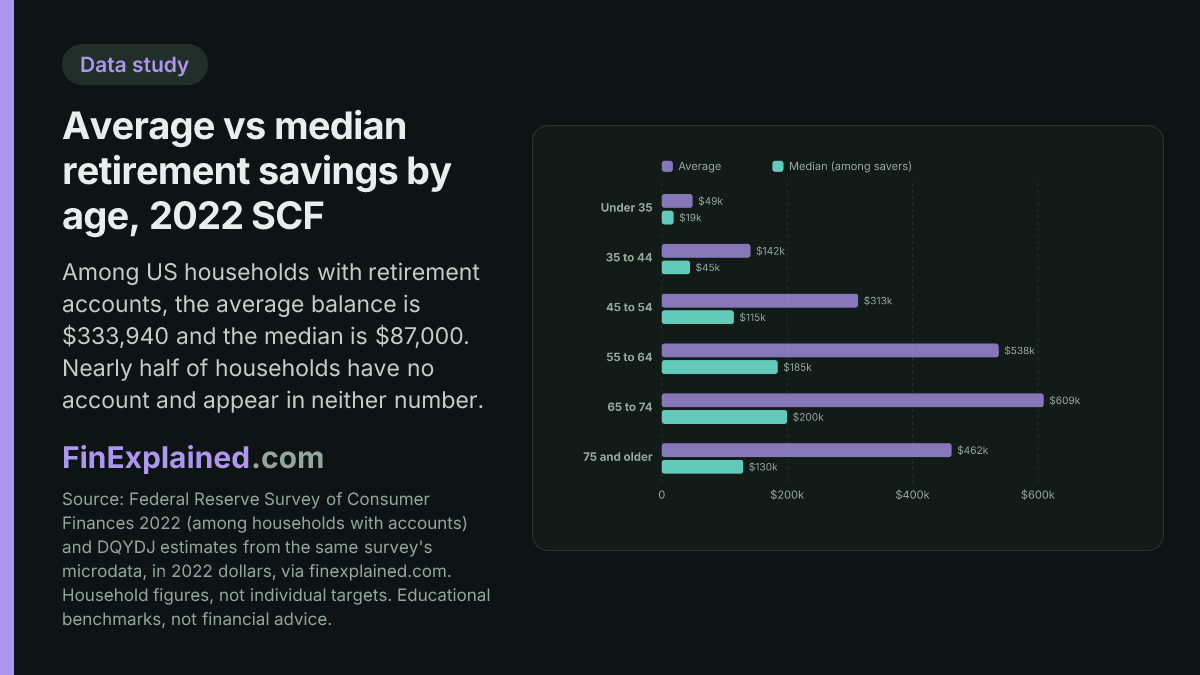
Average and Median Retirement Savings by Age: How Do You Compare?

The median household with retirement accounts holds $87,000. Across all households it is $13,000. Both are the 2022 Fed survey. See both by age.

Source: Federal Reserve Survey of Consumer Finances 2022, among households with retirement accounts, in 2022 dollars. Household figures, not individual targets. Educational benchmarks, not financial advice. Data year 2022.

16 min read Updated

Read the study Download the CSV Embeddable chart Embeddable table

City housing-market dashboards

Monthly-refreshed decision dashboards for one metro at a time: sourced market data with geography and period on every figure, engine-computed affordability math, and per-reader action frameworks.

Companion pages

Built on the same pinned-data discipline as the studies, presenting a study dataset in a different cut.

How every study is built

The same discipline applies to all of them. Figures come from primary sources, the Federal Reserve's Survey of Consumer Finances, the BEA, the Census Bureau, the IRS, and named provider research, and are transcribed into version-controlled data modules, never fetched at build time, so every number changes only through a reviewable diff. Automated integrity suites pin each figure to its source and enforce the structural rules the pages describe, down to blocking checks that fail our build if a study and its paired calculator ever disagree. Projections are computed by the same tested, decimal-precise engine behind our calculators, with assumptions stated beside every chart.

Each study refreshes when its sources publish new data: provider research annually, IRS limits each fall, and the Fed's triennial survey when the next wave arrives (the 2025 SCF, expected in late 2026, refreshes every SCF-based page in one pass). Changes are recorded in the changelog, and the full process lives on how we verify.

Reuse the data

Every table on these pages downloads as a CSV licensed CC BY 4.0: reuse it freely with attribution to FinExplained and a link, with the underlying figures credited to their primary sources as each file's header states. Each study's lead chart and main table are also embeddable as auto-sizing iframes that carry the source line and attribution link built in, so an embed can never show a figure without its provenance.

Writing about this data? The press page has quotable statistics with source lines, reuse terms, and how to reach us.